

How Compass and Atlas Focused the PM3 CAA Anchor Drag Investigation
The finding at PM3 CAA
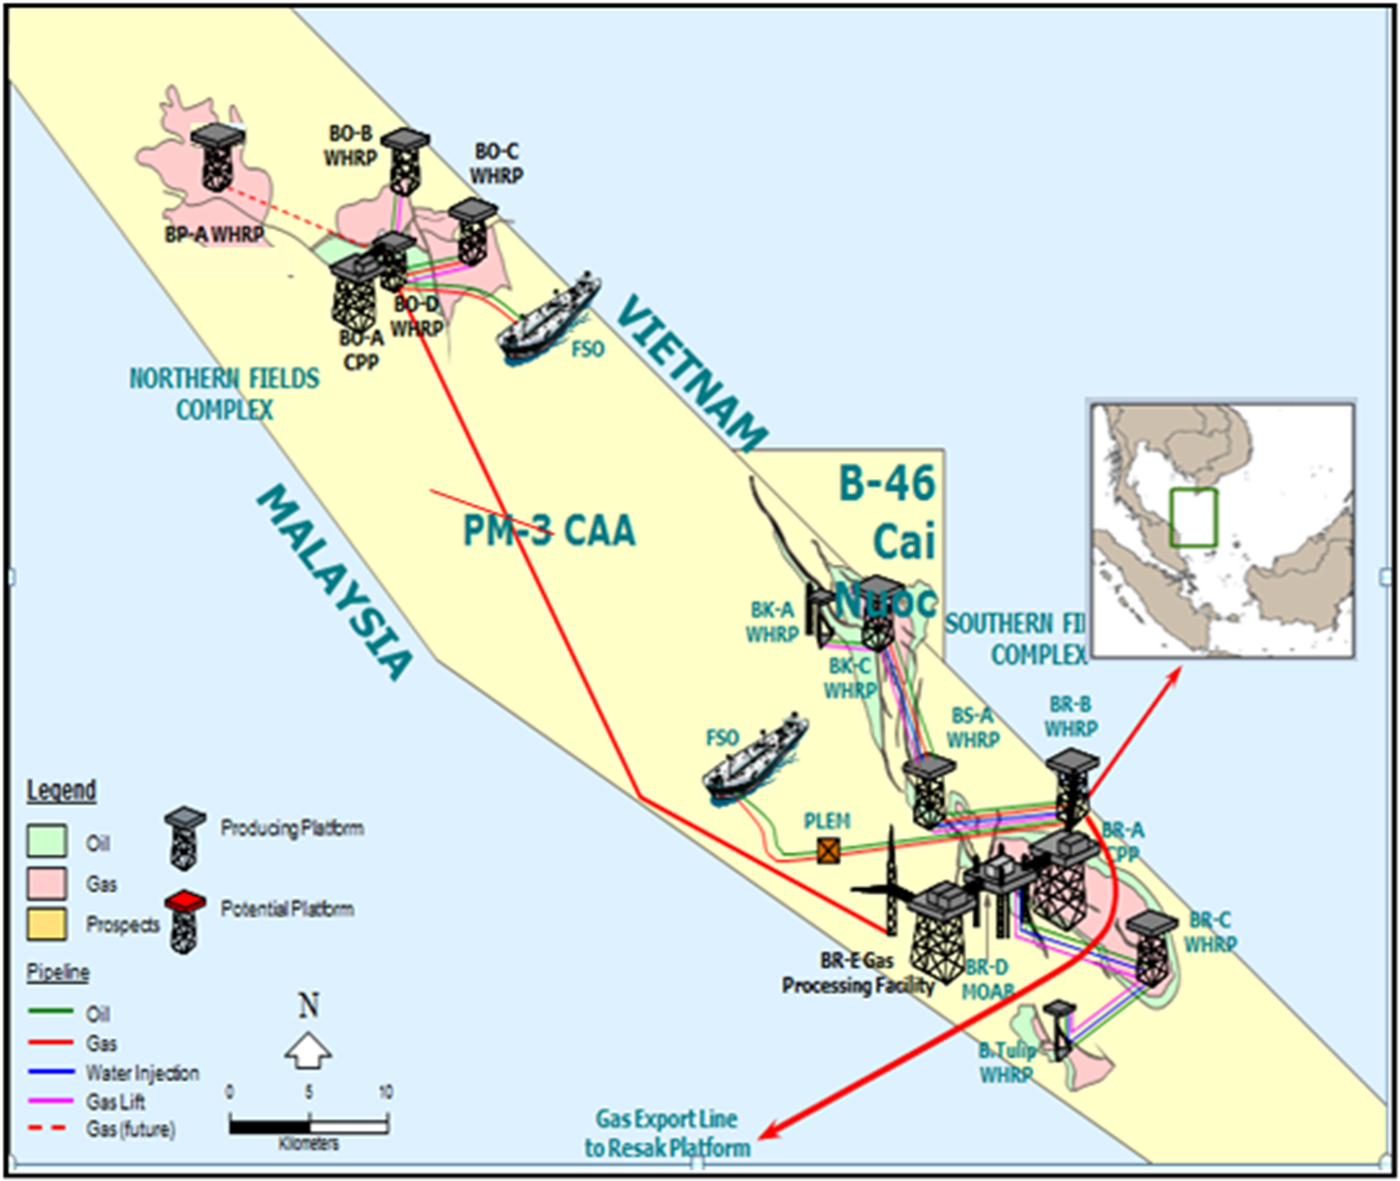
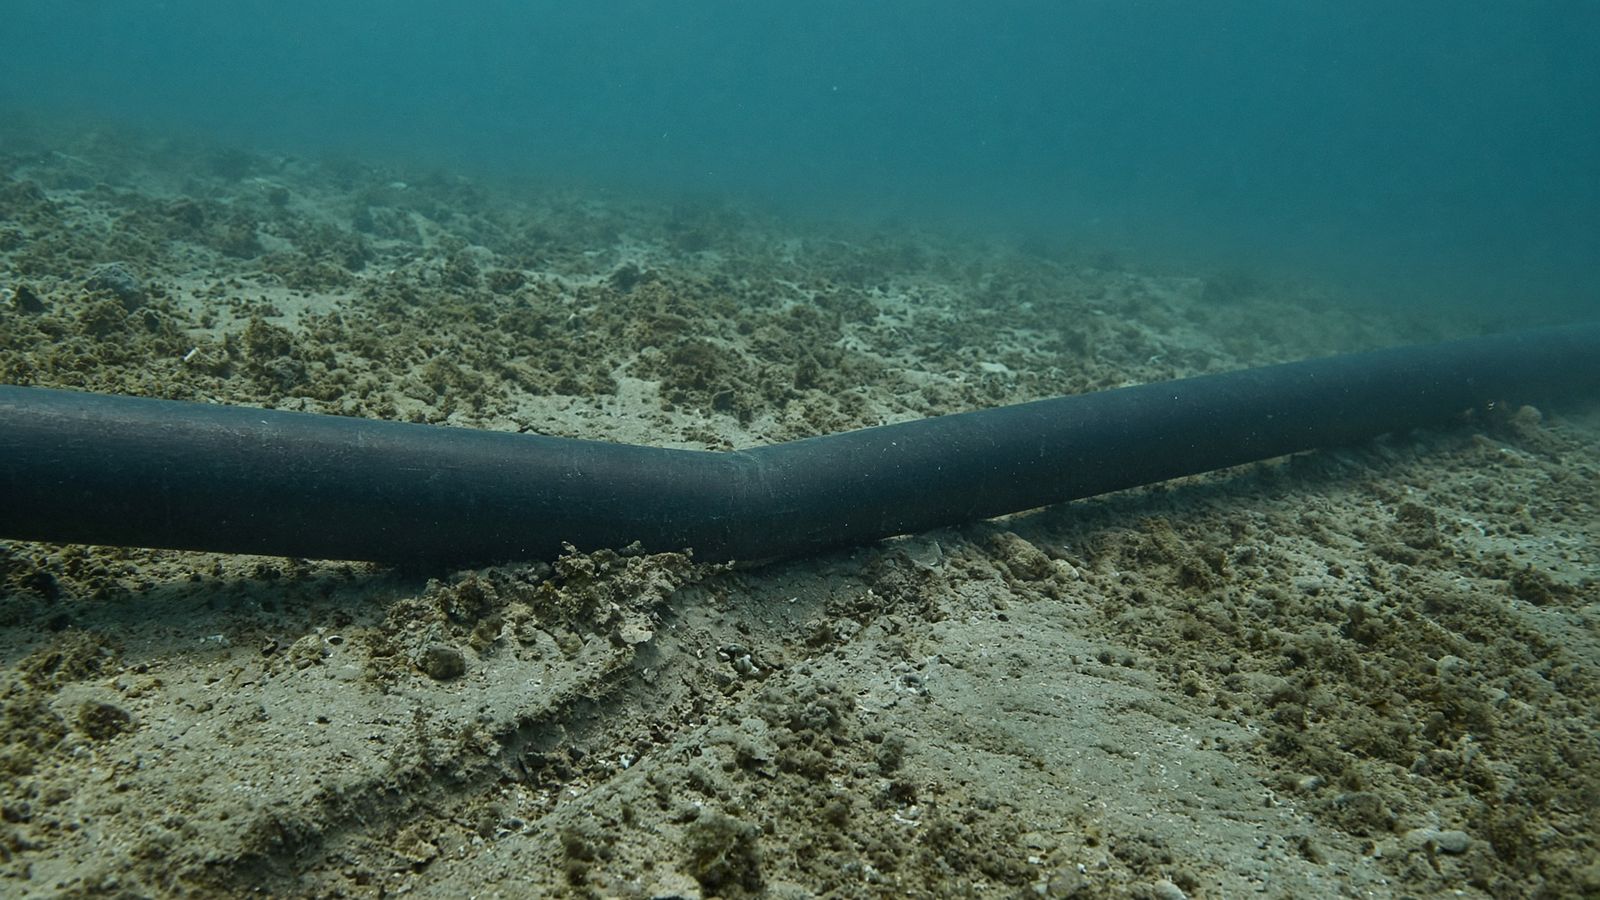
In 2014 an ROV inspection at PM3 CAA, the shared production area between Malaysia and Vietnam, found a 4 inch gas lift line pushed off its route with a small kink where it had been bent. The line runs between the BR-C and BT-A platforms in the southern fields. The cause was an anchor dragged across the seabed. A later independent audit of the field listed four gas lift lines with anchor drag damage.
A condition report tells you a line is bent. It does not tell you who bent it, when, or how far the damage runs. Those three answers decide how big the survey has to be, and the survey vessel is the expensive part of any investigation.
What the investigation had to establish
Three things, before anyone booked a vessel.
When. July 2014, placed from the vessel timeline in Compass.
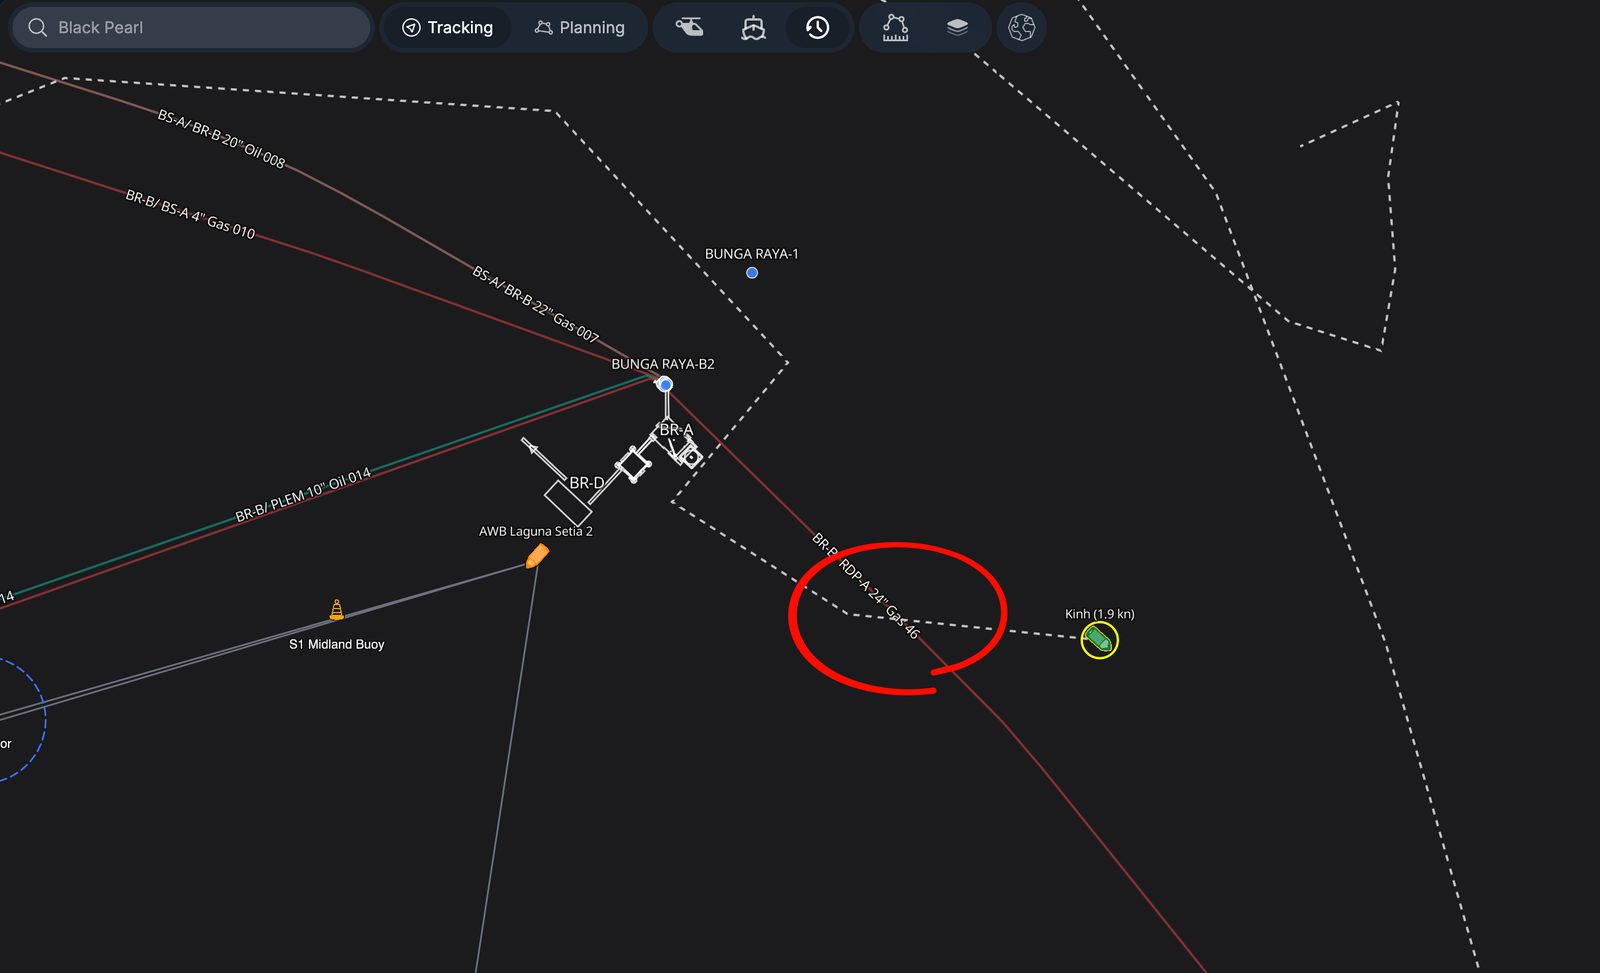
Which vessel. The L Kinh, identified in Compass playback. Supply boats, anchor handlers and barges all cross the corridor, so the field had plenty of candidates.
Where. The line had been dragged off its route and kinked. The corridor itself runs for kilometres.
Settling those three at a desk is what kept the survey small. The alternative is sonar and ROV over the whole corridor, paid for at the vessel day rate.
One map from two systems
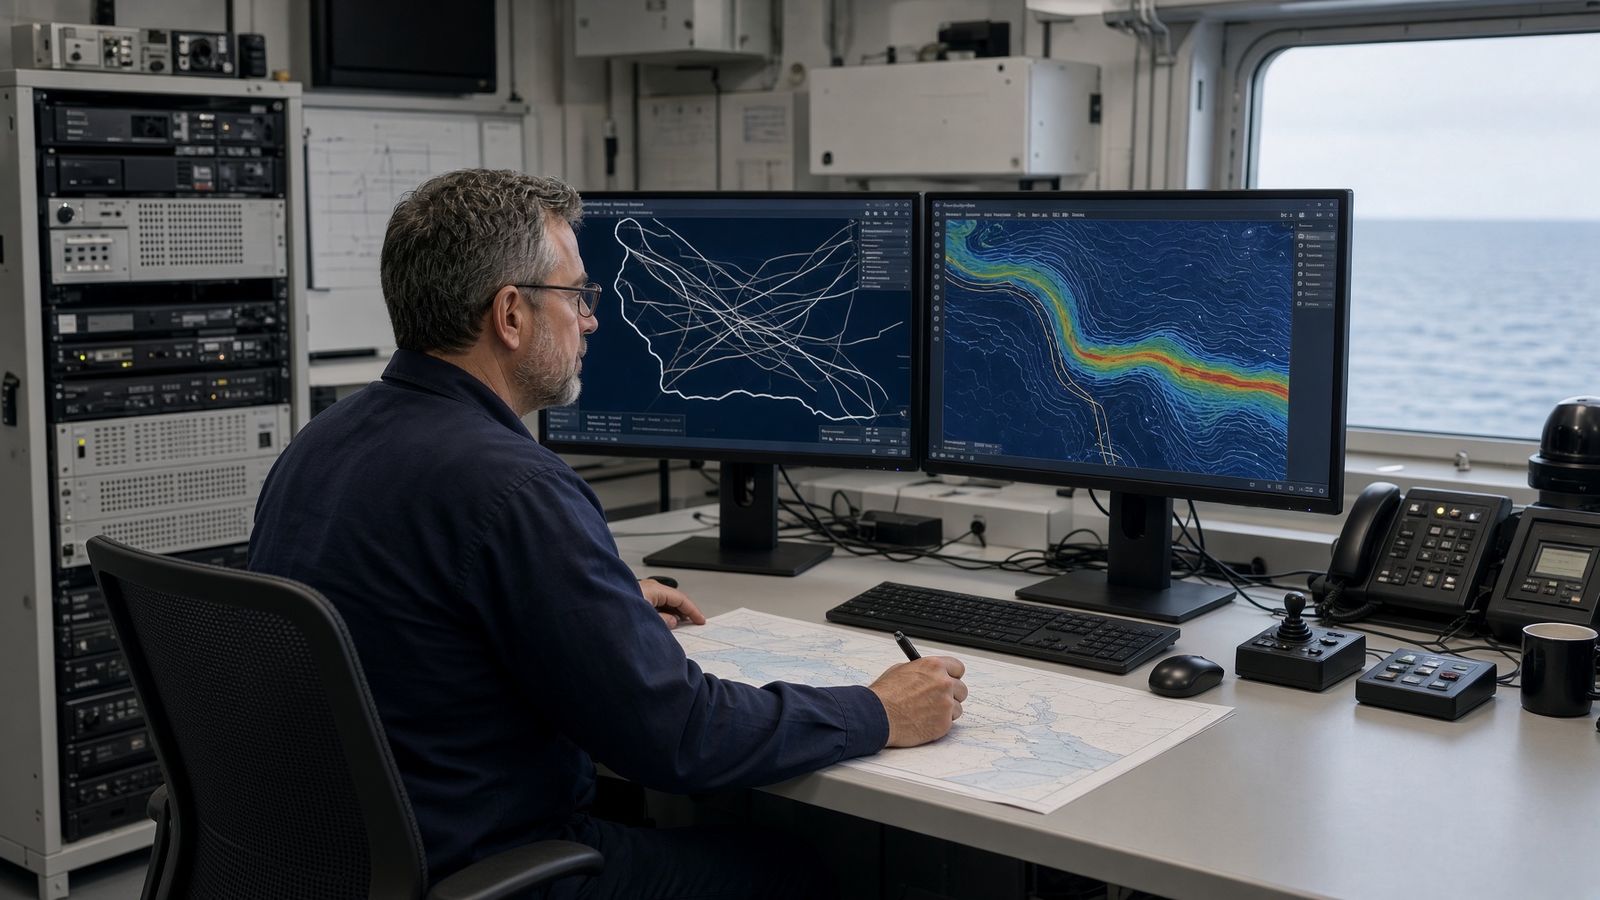
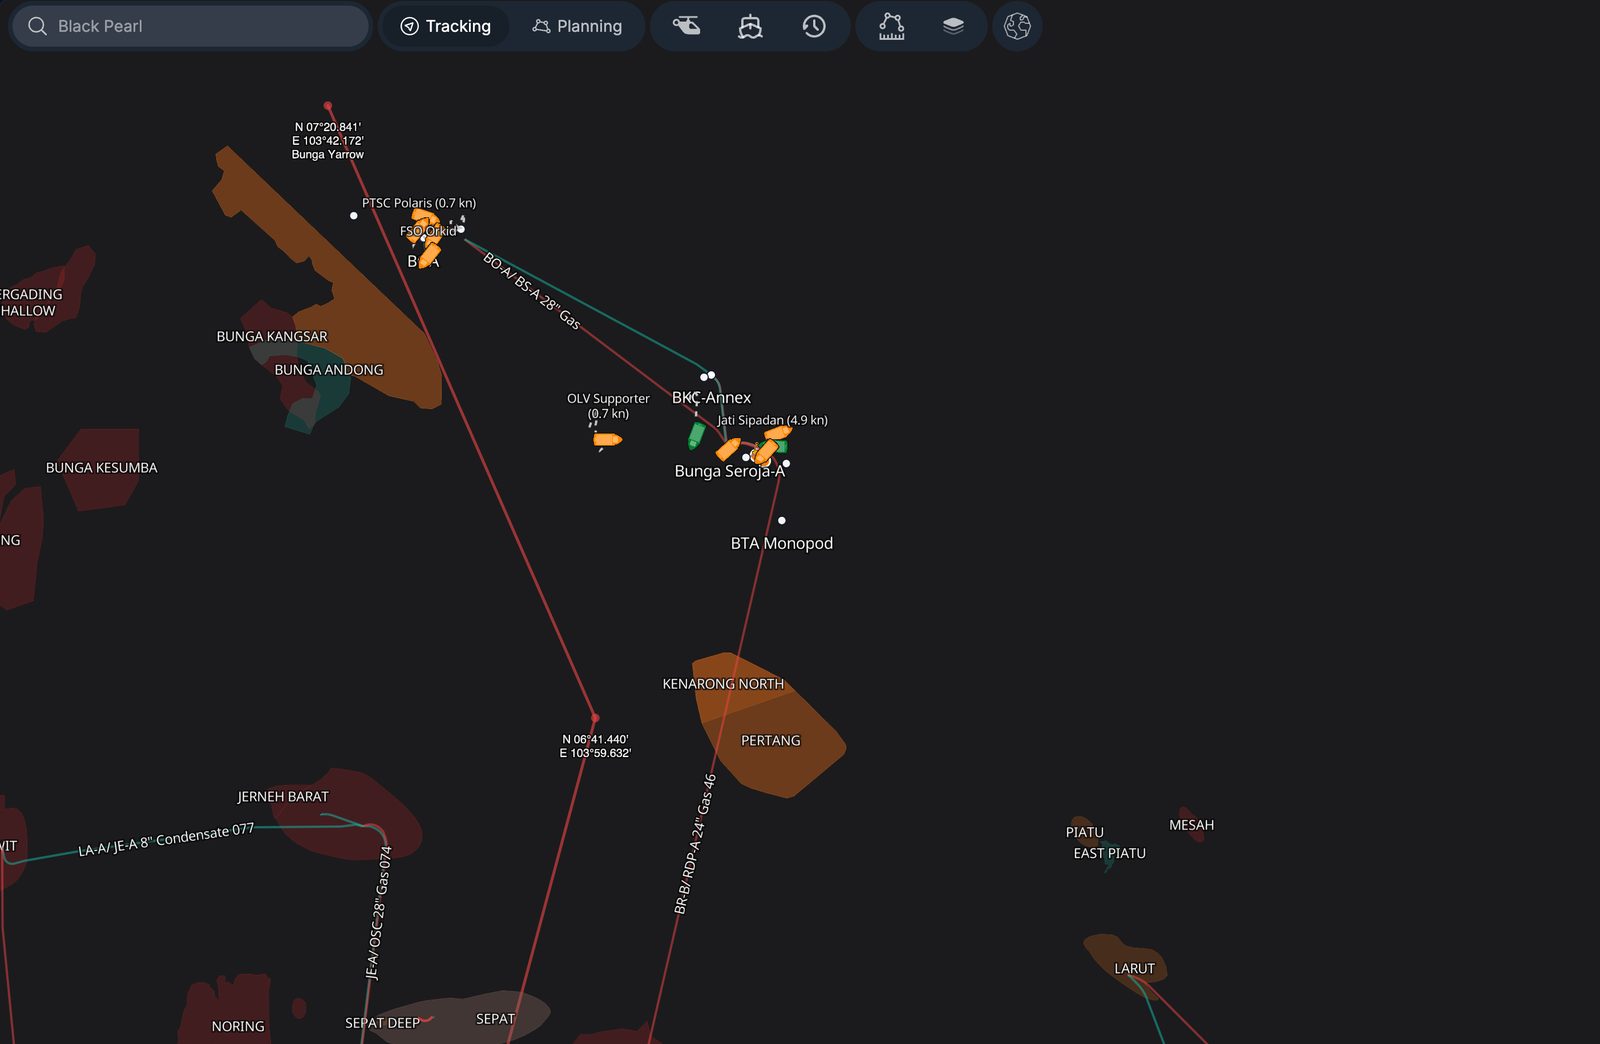
Compass and Atlas ran before the field survey, in that order. Compass built the vessel picture: which vessels were near the line, when, and what they were doing. Atlas built the seabed picture: where the line runs, where it is exposed, and what earlier inspections had seen. Sonar and ROV then went only to the places where the two pictures agreed.
Compass: the vessel picture
Compass keeps the historical track of every vessel in the field and replays it second by second. The team ran the corridor at one second resolution and looked for the behaviour that comes before an anchor strike.
- Replayed every crossing of the pipeline at one second steps
- Flagged stops, drift, anchoring and departures from the usual route
- Ranked the time windows and track sections worth checking
The output was a short list of vessels, times and crossings, with the L Kinh at the top of it.
Atlas: the seabed picture
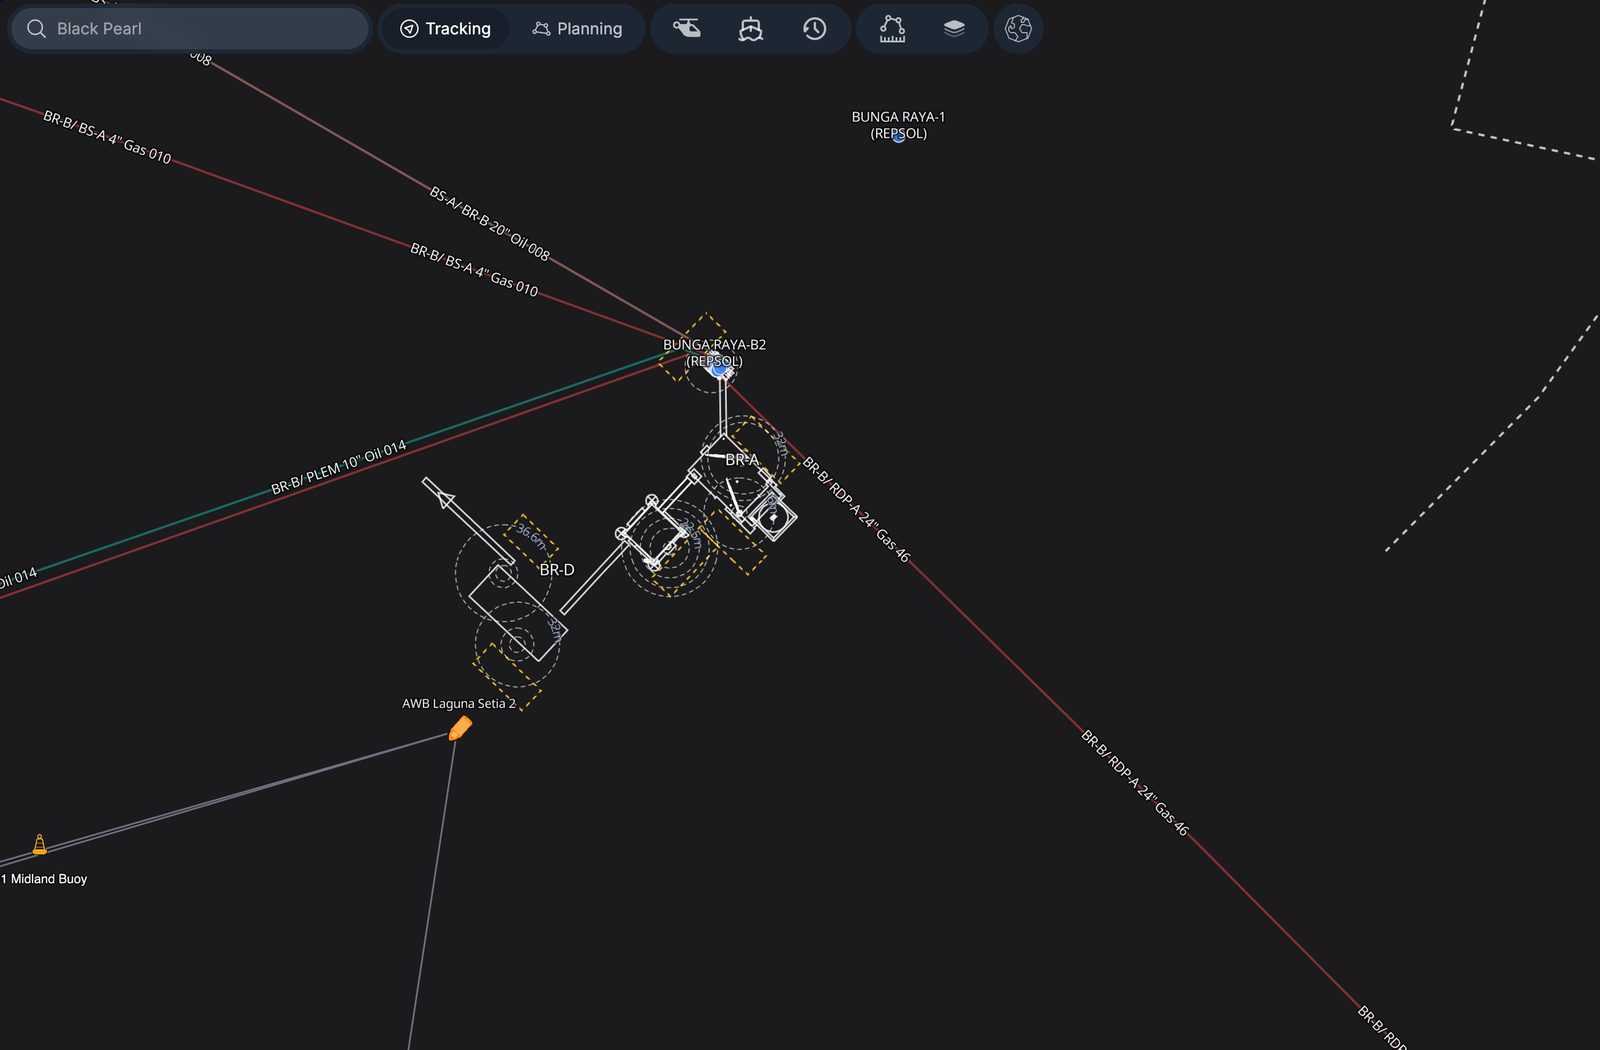
Atlas holds the pipeline centreline, every crossing, the bathymetry and each earlier ROV observation for the field. The Compass shortlist was laid over it.
- Combined centreline, crossings, bathymetry and prior ROV evidence
- Matched the shortlist against the exposed sections of the line
- Drew priority polygons for the physical survey
The output was a smaller area for sonar and ROV.
Where the two pictures overlap
The survey plan was the intersection. Each polygon in it had three things attached: the vessel movement that put it on the list, the pipeline geometry underneath it, and whatever an earlier inspection had already noted there. That gave the survey team a reason for every planned pass, and a way to trace any finding back to the desk review that predicted it.
Field confirmation
- Compass put the L Kinh on the line in July 2014.
- Atlas set the area to investigate.
- The combined map ranked the sections to survey.
- Sonar and ROV confirmed the geometry, the displacement and the kink.
- The confirmed findings went into the remediation plan: concrete mattresses over the damage.
Without second by second playback
Without playback there is no way to put a named vessel on the line at a given second. The search area grows to the whole corridor plus a margin either side. That means more survey lines, more repeat passes, more sonar data to process, and a cost that climbs with every extra kilometre of seabed the vessel has to cover.
With Compass and Atlas the L Kinh was placed on the line in July 2014 from one second playback, the search area shrank to the polygons where track and pipeline meet, each polygon had a defined pass, and vessel days were spent only where the evidence pointed.
The survey bill is set by how much seabed the vessel has to cover. Playback is what kept that number small.
What changed
- Smaller survey area. The vessel only went to the polygons, not the whole corridor.
- Fewer lines, fewer passes. Each polygon had a defined pass. Nothing was surveyed twice for want of a plan.
- Less vessel time. Fewer lines means fewer hours at the day rate and less sonar data to work through.
- Traceable evidence. Every finding on the seabed links back to a vessel movement or an inspection note.
- Lower cost. Fewer vessel days, less data to process, and no repeat mobilisation.
Anchor drag is a standing risk
The 2021 independent audit of PM3 CAA rates pipeline anchor drag as a medium to high integrity risk, with concrete mattresses as the fix. Four gas lift lines already carry the damage: BRC to BTA 04GL, BRB to BSA 04GL, BSA to BKC 04GL and BKC to BKA 04GL.
Every field with supply traffic over pipelines has the same exposure. The desk workflow in this case is not tied to one incident. It runs whenever a survey is about to mobilise: Compass for the traffic, Atlas for the asset, then the vessel goes where the two agree.
Sources
- Hibiscus Petroleum Berhad, Circular to Shareholders Part 2, Competent Person's Report by RPS, Rev 3, 25 June 2021. The independent technical audit of PM3 CAA published to shareholders. ir2.chartnexus.com/hibiscuspetroleum/docs/circular/Circular-to-shareholders-Part-2.pdf
- Hibiscus Petroleum Berhad, PM3 CAA Competent Person's Report, May 2025. Source of the field layout map. hibiscuspetroleum.com
- PETRONAS, PETRONAS and PETROVIETNAM Extend PM3 CAA Production Sharing Contract. petronas.com
- The seabed and desk images are illustrations. The field map is from the May 2025 competent person's report. The other maps are screenshots from Compass.